Wx Now App
Experience weather like never before with our cutting-edge Progressive Web App. Designed for all users, it delivers global forecasts with stunning graphics and visual effects in one glance – no clicks needed. Perfect for quick mobile updates or as a dedicated weather station on larger screens, it adapts seamlessly to your needs. With an AI-powered travel guide offering local insights, our app provides a comprehensive, engaging weather experience across all devices. Download today and transform how you interact with weather information, anytime and anywhere.

Live site: www.wxnow.app | Built using: Remix, React, Recharts, Mapbox, ExpressJS geojson server | Data: Apple Weatherkit, Rainviewer, Open Weather, NOAA, ChatGPT, Gemini, Anthropic, Perplexity
Features
Weather Now is a "weather station" application and meant to be displayed constantly. The page refreshes every 5 minutes so you will always see the most up-to-date weather information. Weather Now has been designed to scale to all devices from mobile devices to huge displays. If you want a quick view on your phone or a realtime weather station on your kitchen counter, Weather Now has you covered.
Tips
- Errors or Layout issues: Refresh the page. On Mobile or Tablet, drag the page down until it refreshes.
- Location search issues: If using the find my location button is not returning results. Check the app has permissions to access locations. This is usually in a privacy setting. If nothing else works try typing your location using the text search.
- Reset Map: When you change the map in any way, running radar, zooming in, clicking on new location, you can get back by clicking the home button that appears next to the animation control panel
- Click on the graph to see the values for that time.
The Minutely Forecast Graph

Today Forecast - AI Generated
Using LLMs to generate a text summary given the raw weather data from Apple WeatherKit's hourly forecast. Currently using chatGPT gpt-4o-mini, Gemini gemini-1.5-pro-latest, and Anthropic claude-3-5-sonnet-20240620. You will see an Icon at the end of the text showing which LLM generated the text.

Forecast - AI Generated
Using LLMs to generate a text summary given the raw weather data from Apple WeatherKit's hourly forecast. Currently using chatGPT gpt-4o-mini, Gemini gemini-1.5-pro-latest, and Anthropic claude-3-5-sonnet-20240620, Perplexity llama-3-sonar-large-32k-online. You will see an Icon at the end of the text showing which LLM generated the text.

News - AI Generated
Using Perplexity llama-3-sonar-large-32k-online. This is the only engine that can generate current news (sometimes).

Guide - AI Generated
Using four LLMs chatGPT gpt-4o-mini, Gemini gemini-1.5-pro-latest, and Anthropic claude-3-5-sonnet-20240620, Perplexity llama-3-sonar-large-32k-online. Giving the LLM the location we ask it to act like a travel guide and return information about one of the following topics: 'Geography', 'History', 'Demographics', 'Culture', 'Government and Politics', 'Infrastructure', 'Food and Cuisine', 'Sports and Recreation', 'Community and Lifestyle', 'Indigenous People', 'Local Attractions', 'Nightlife', 'Travel Tips', 'Wildlife and Nature', 'Local Crafts and Artisans', 'Day Trips and Excursions'. You will see an Icon at the end of the text showing which LLM generated the text. There is also a link to more regional news. This will take you to an expanded version of this text with a few additional stories

The Hourly Forecast Graph
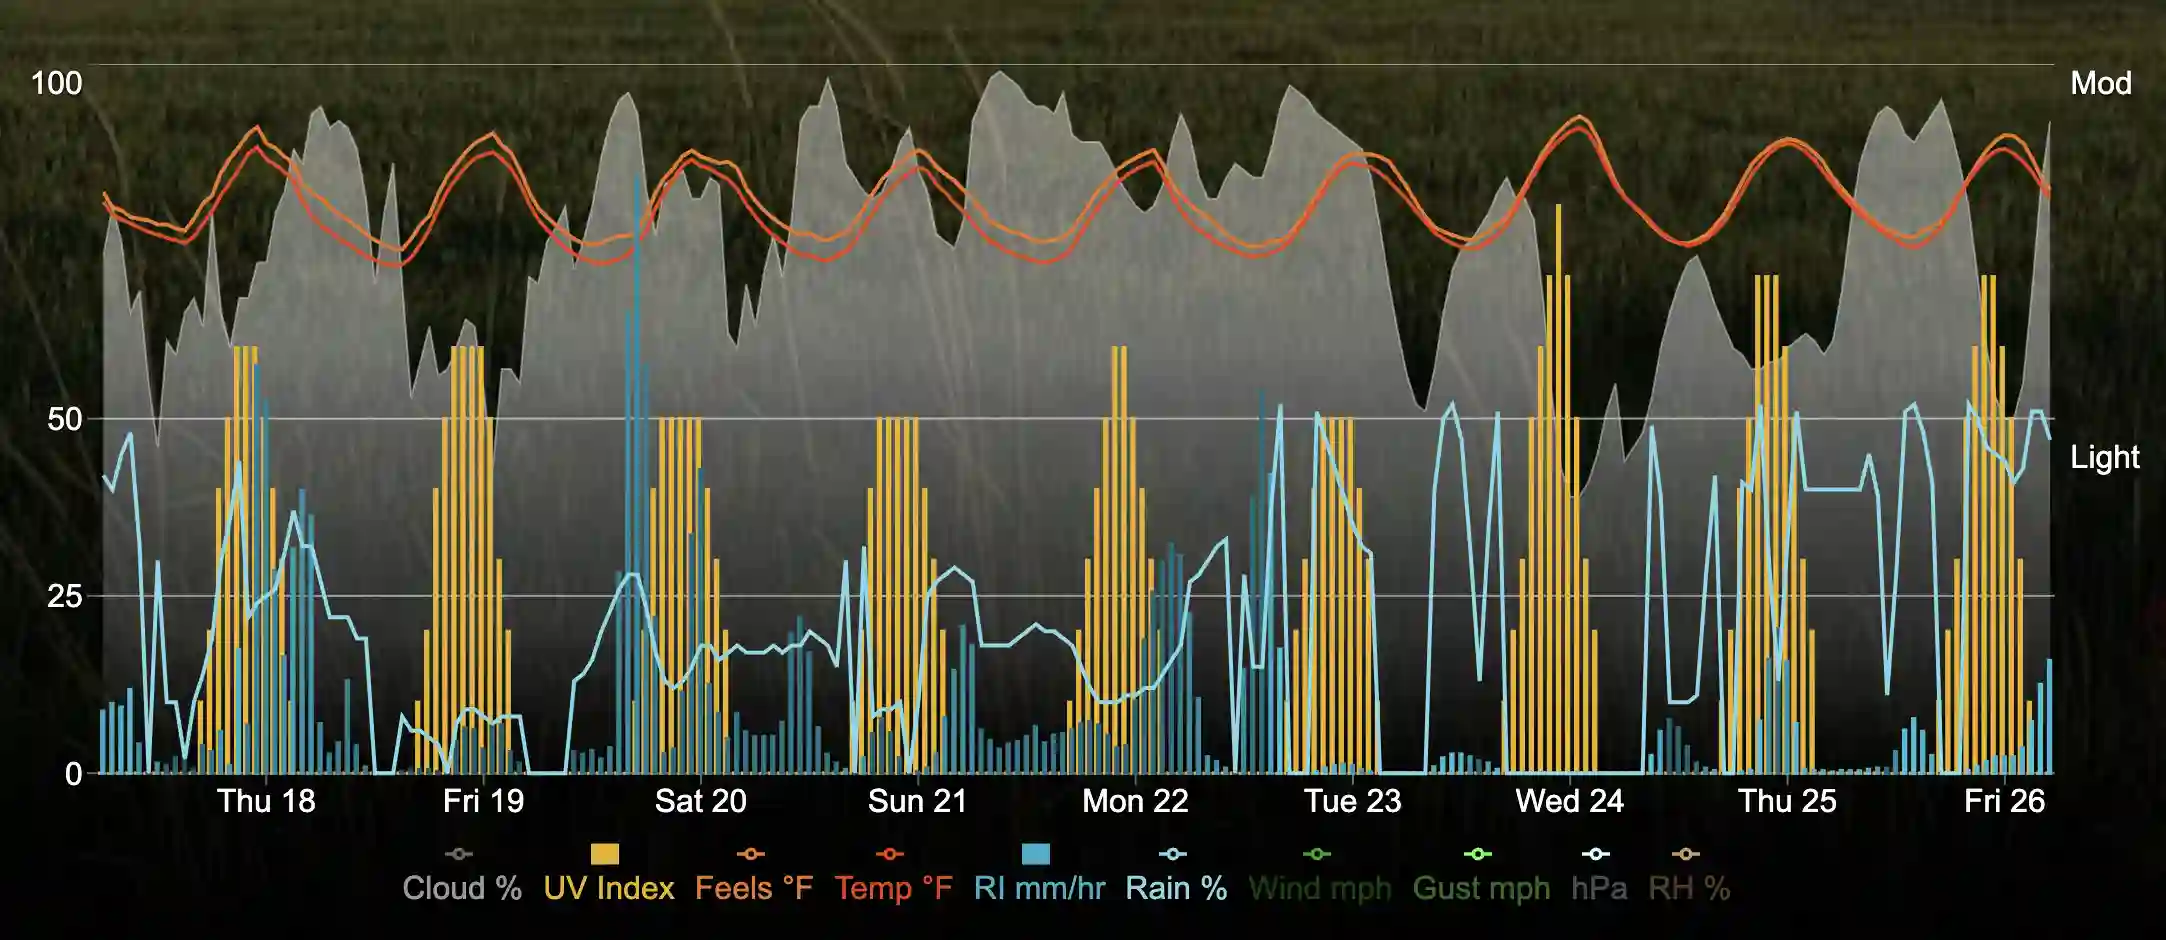
The graph is meant to give you a quick visual representation of the weather forecast. The mix of Cloud Cover, UV Index, and precipitation together provide a very thorough view into what to expect on those days and when.
One of the unique things that comes from plotting the UV Index is that it clearly shows each day so there is not much mental processing to figure out when in the day something is going to occur.
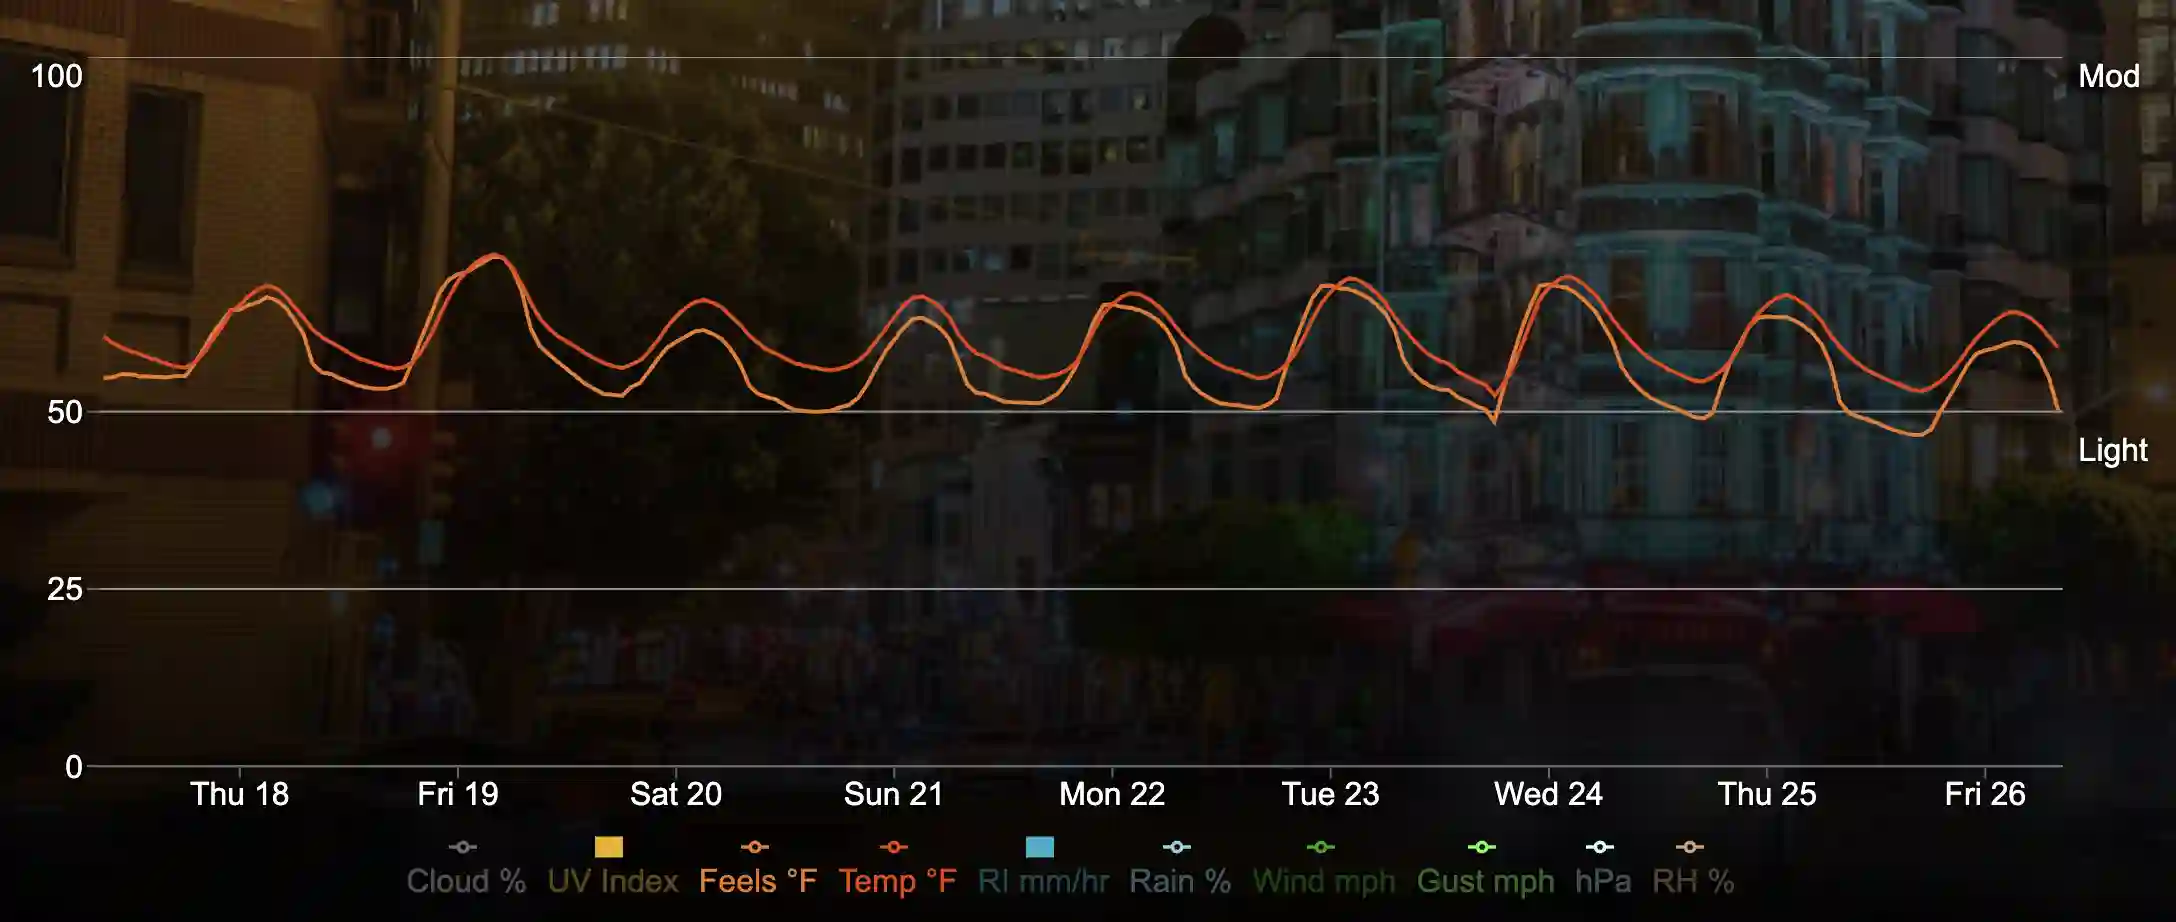
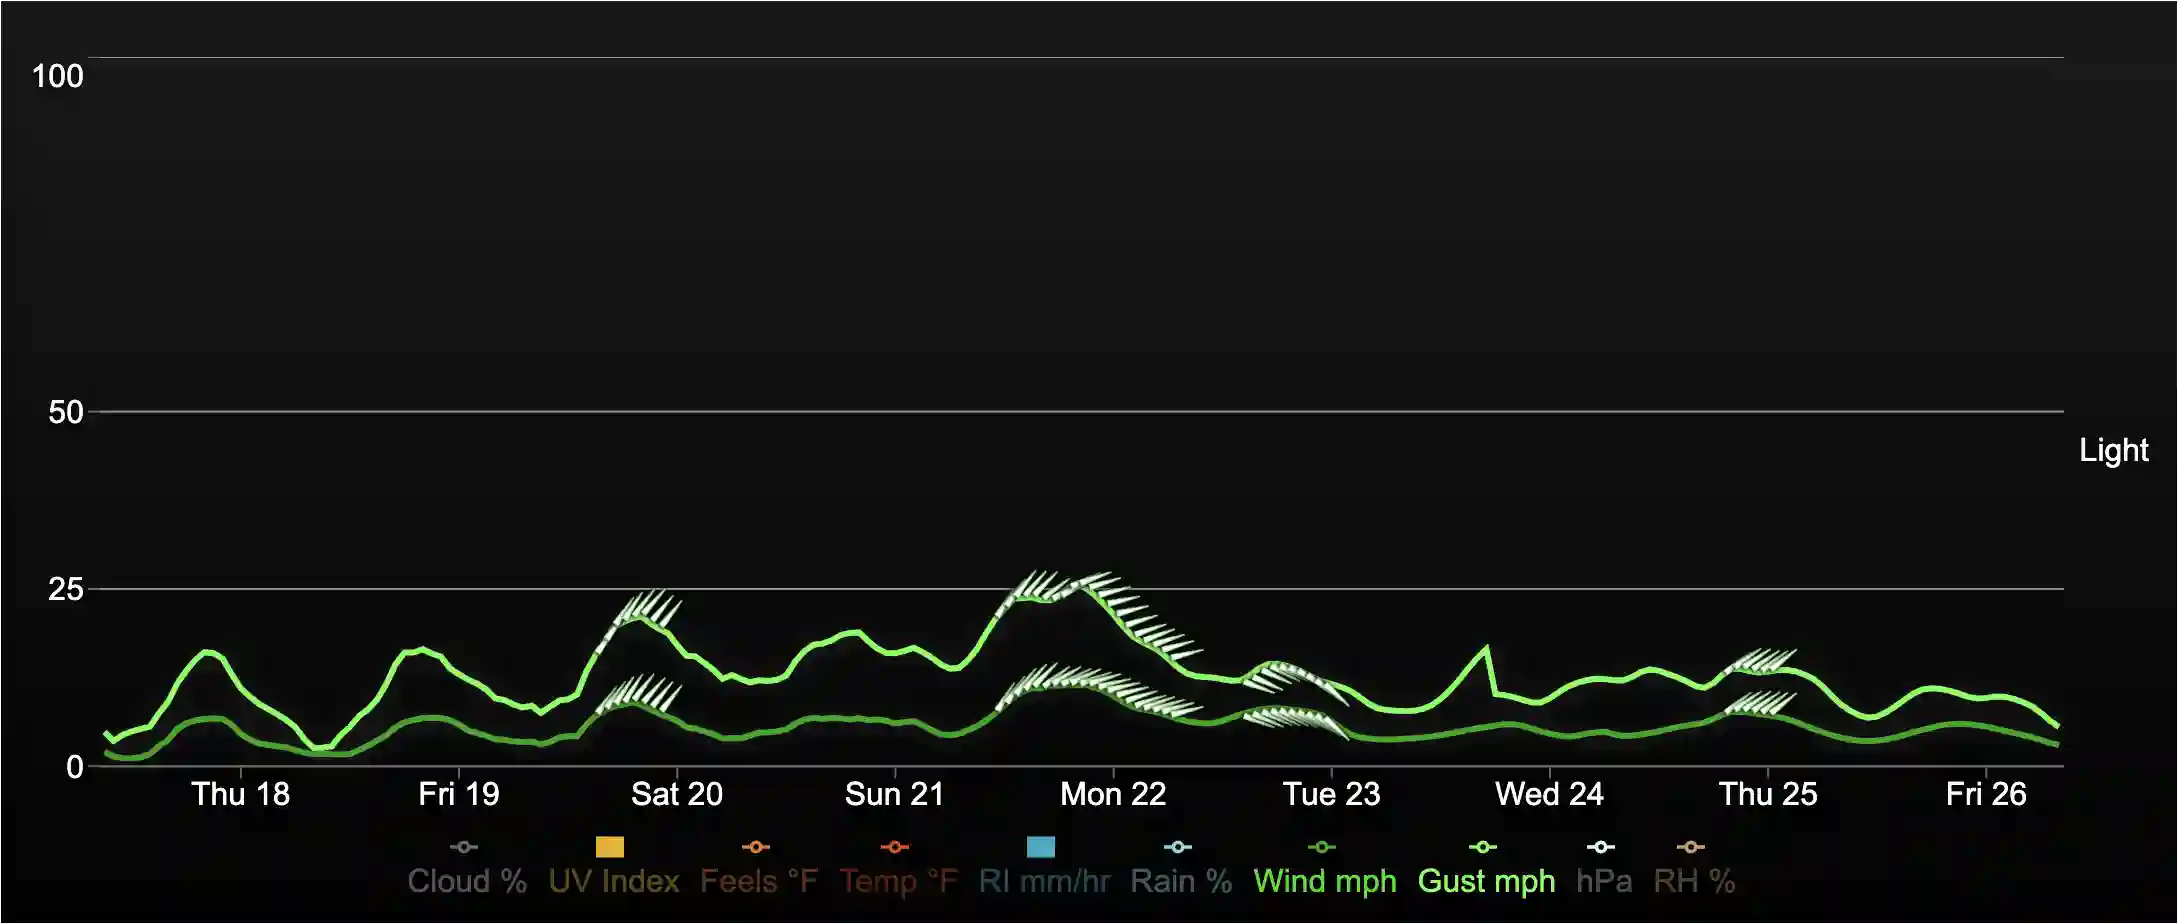
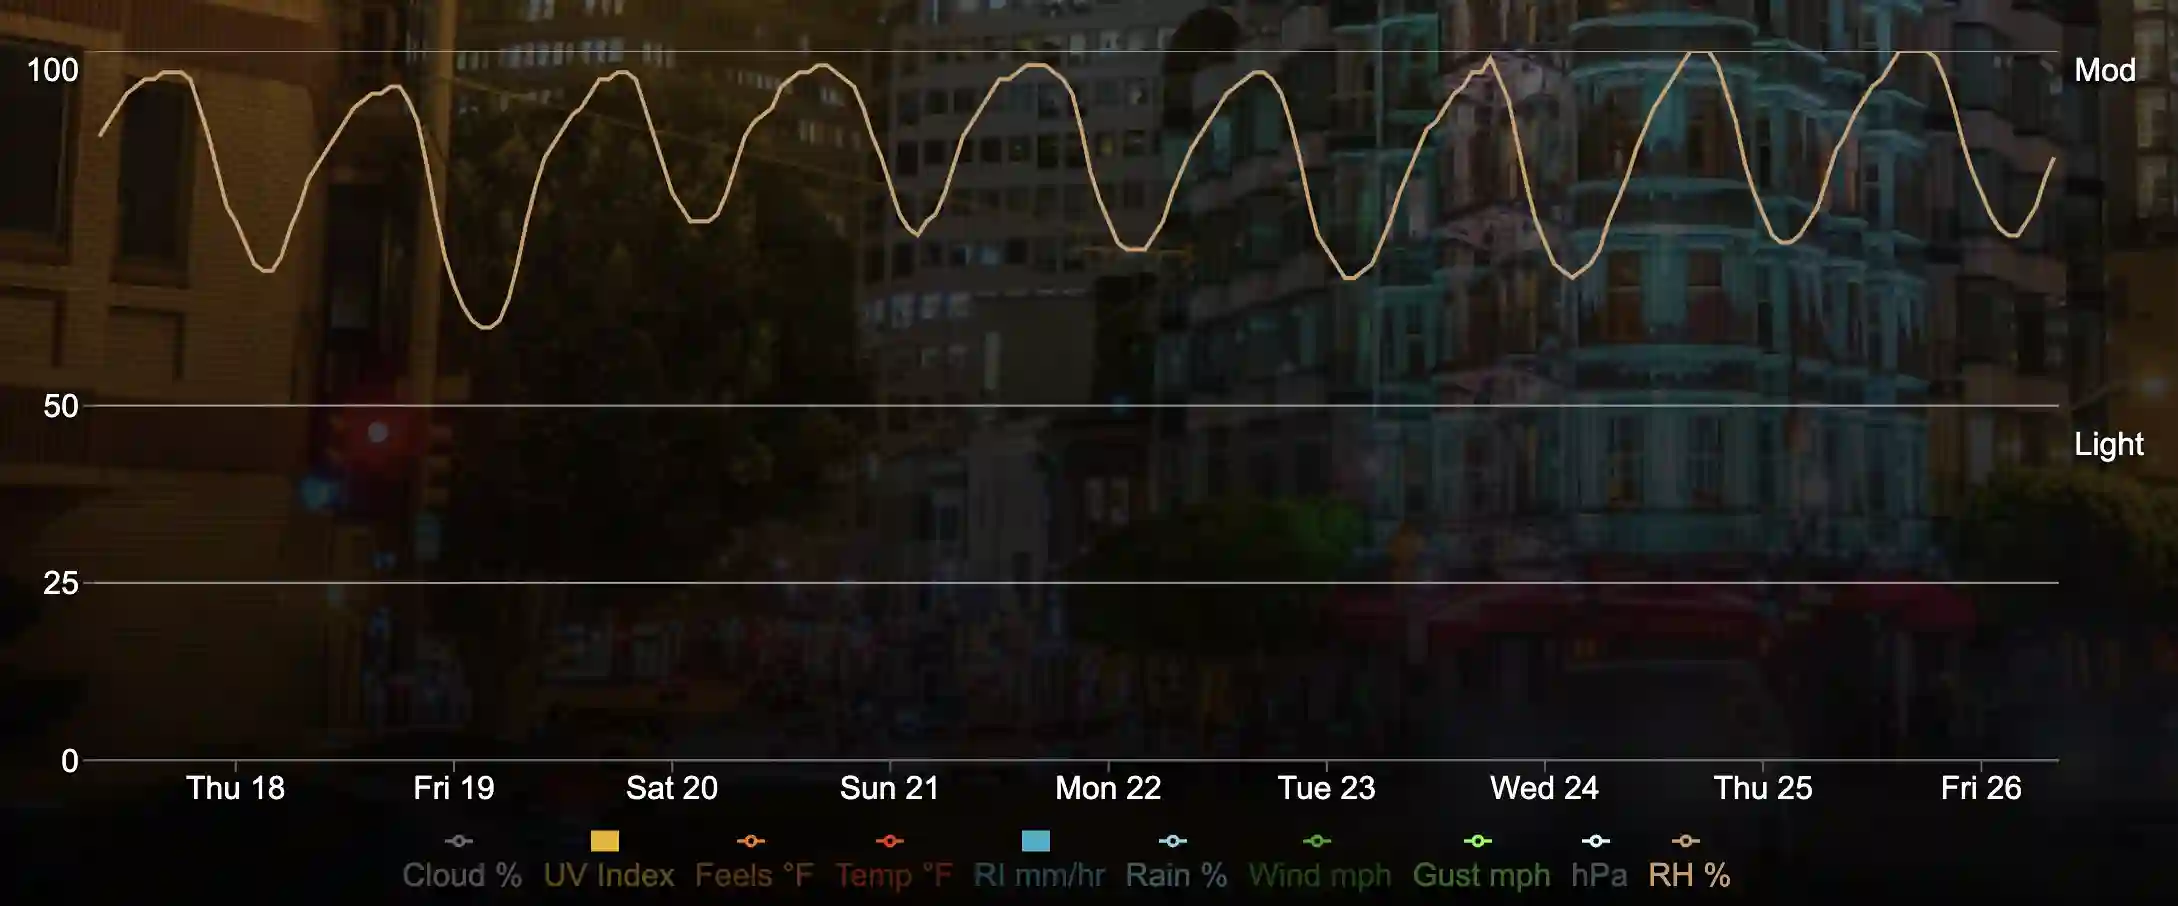
Everything on the graph can fit on a scale of 0 to 100 as most values are percentages. UV Index, Temperature, Precipitation Intensity and Wind Speed are the only values that are not percentages and are plotted on the same value scale of 0 to 100. Temperature will go above 100 and below 0 and in those cases the y axis will scale to fit the data.
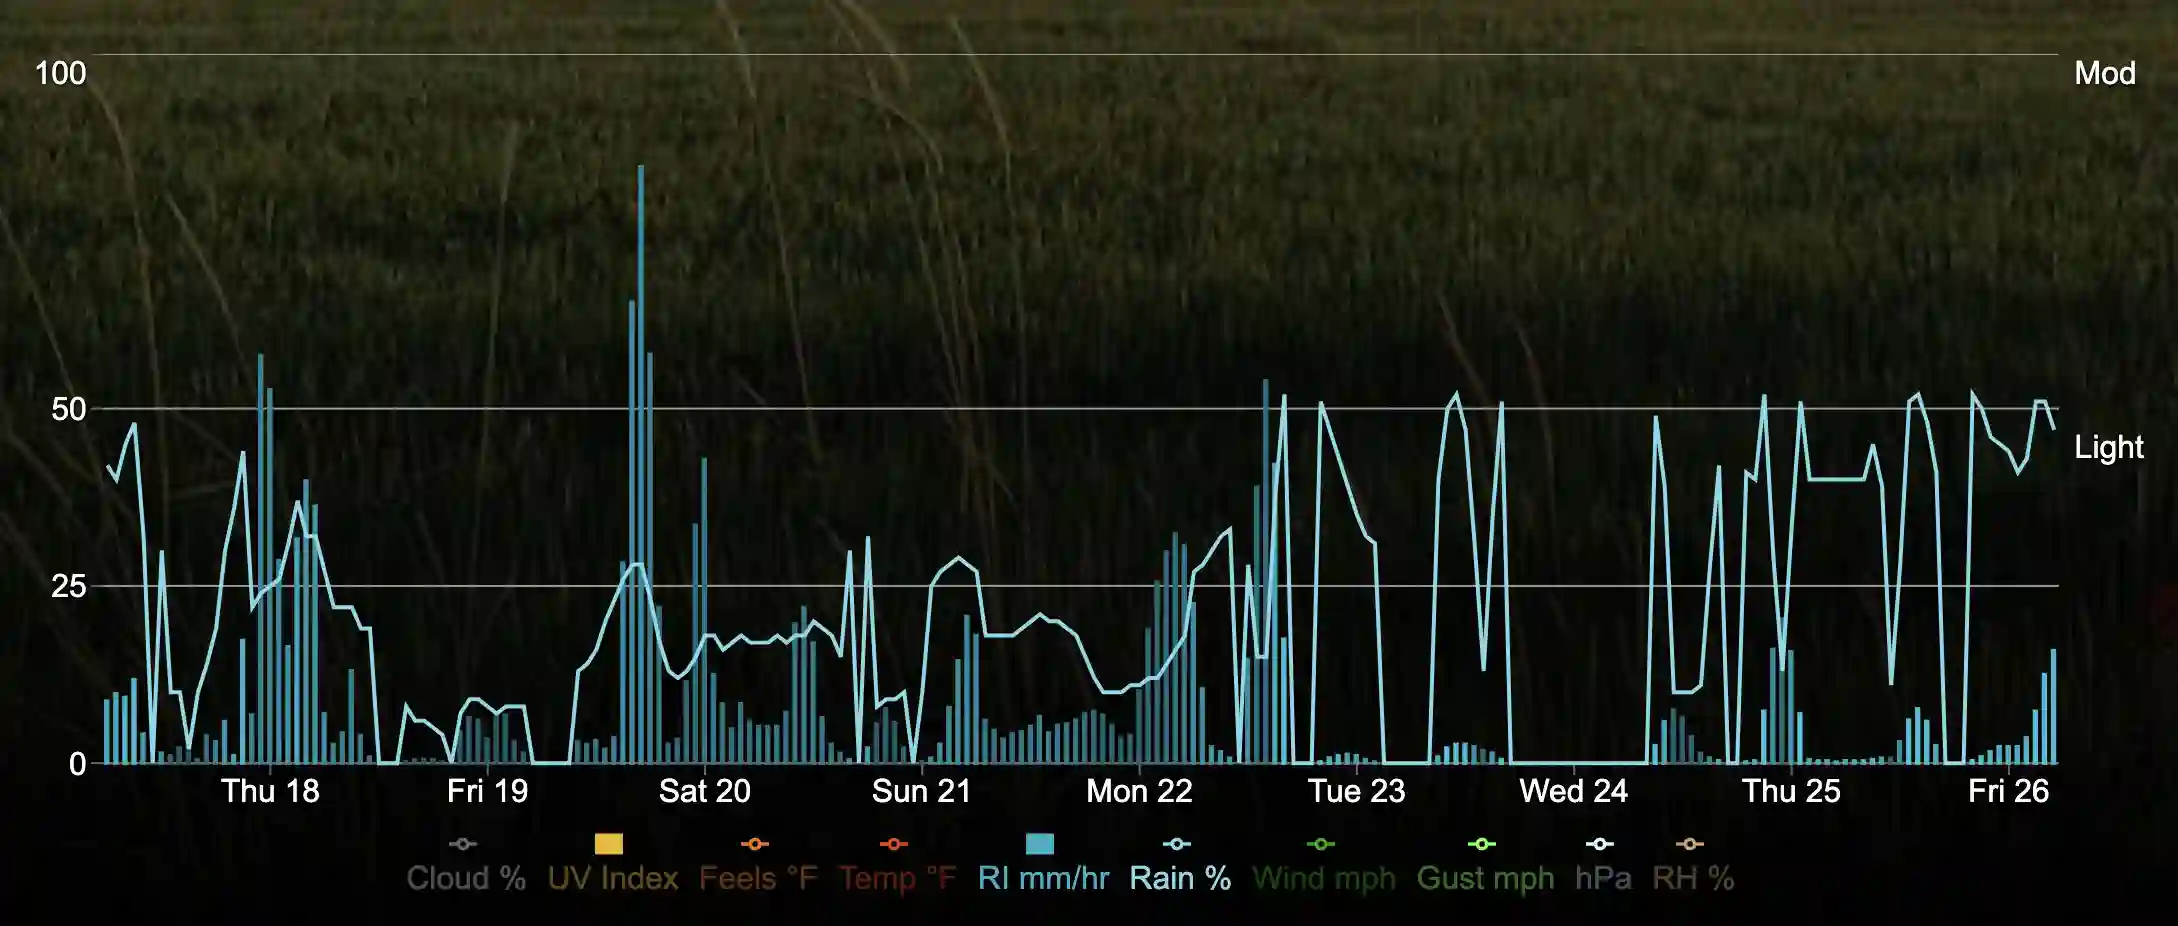
Precipitation (mm/h)
Rain Intensity has it’s own y axis on the right side. The values are:
Light rain: Less than 2.5 mm/h
Moderate rain: 2.6 to 7.5 mm/h
Heavy rain: 7.6 to 50 mm/h
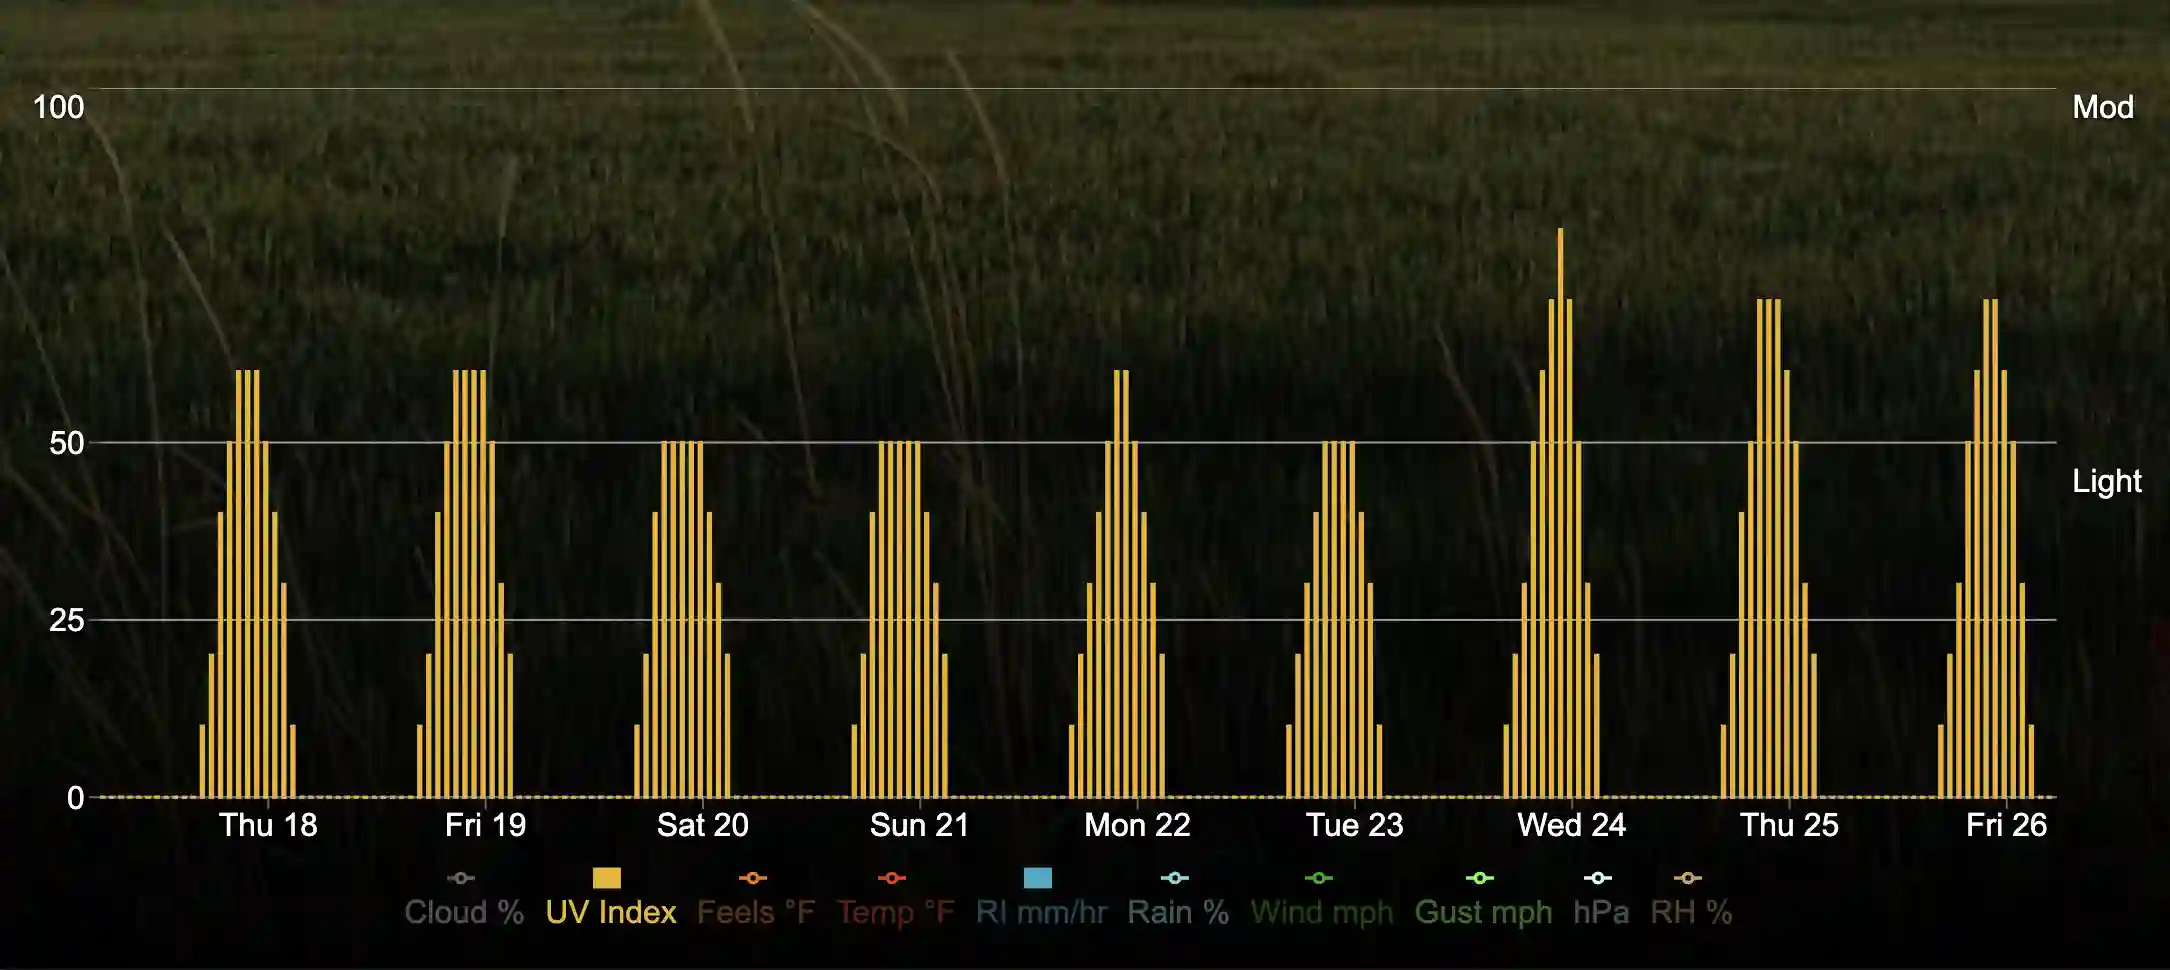
UV Index
UV Index gets scaled by 10x, so 100 = 10 UVI.
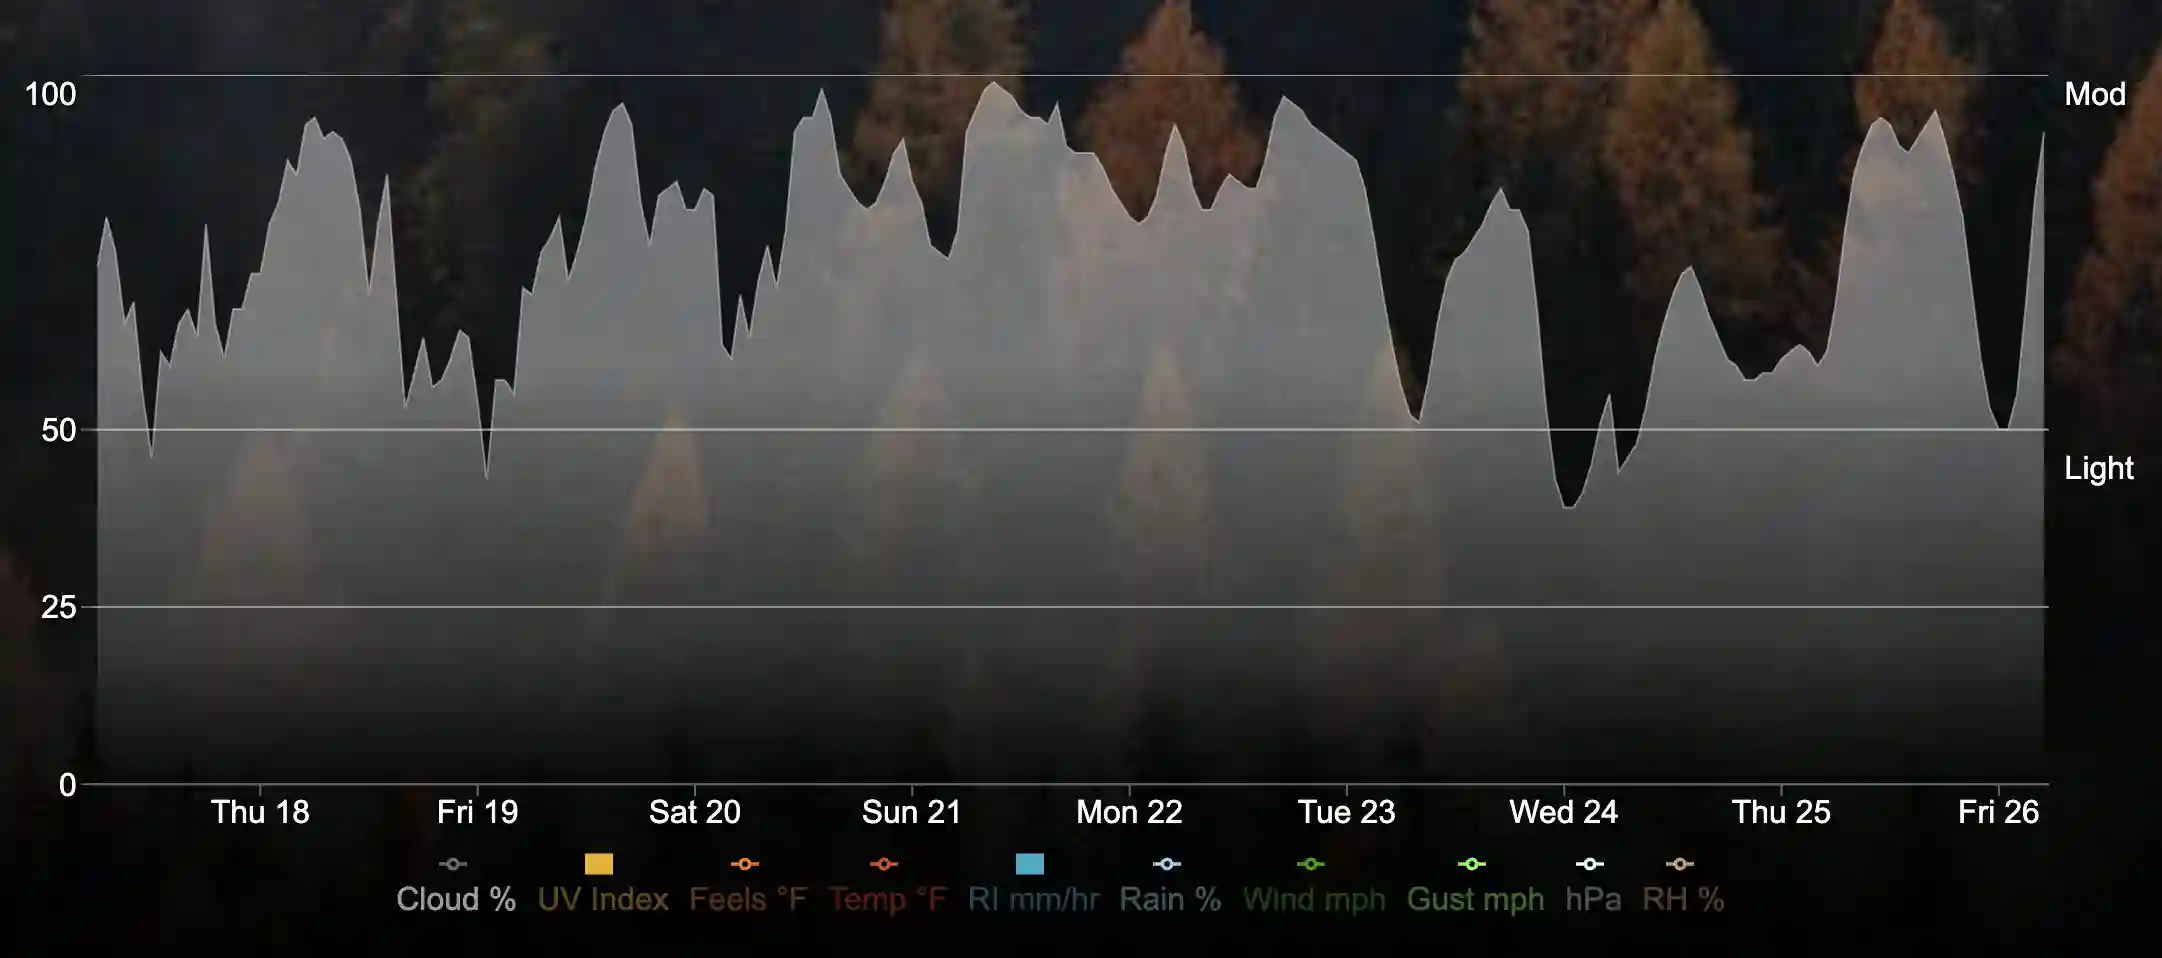
Cloud Cover (%)
Temperature
Wind Speed
Wind Speed will show "wind flags" when the wind speed is 7 mph or greater. The "Wind flags" hang on the wind line and flag with the direction of the wind. Wind speeds of 7 mph or less are not worth showing as they are not really noticeable.
Relative Humidity (%)
Pressure (hPa)
Pressure has been normalized to fit 0 to 100 scale. This helps to see the pressure trends.

Settings
Divided into two sections. One for map layers and controls the other for general app settings, like unit preferences and tooltip location.

Animation Panel
Control to animate the radar and cloud cover. Bottom of control shows a 4 day hourly AQI forecast. Mousing over or clicking the small squares will show details for that hour .

Street View
Pretty hidden, but if you click on the dashed lines below the map you will get a street view of your selected location. It can be expanded to a full screen. It is still a bit buggy and you may need to refresh the app when returning back to the main screen.


